How Canadians earn a living
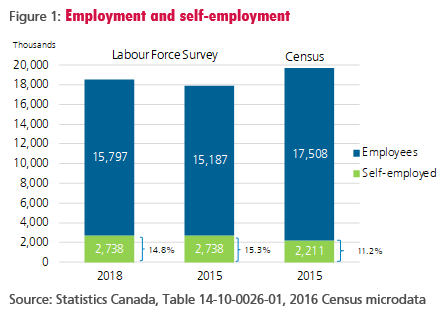
A substantial number of workers in Canada depend on themselves for employment. The Labour Force Survey shows that roughly 15 per cent of Canadians are self-employed in any given month. The Census defines them over an annual timeframe, giving it a slightly lower proportion of the work force (about 11 per cent). The difference hints at how fluid self-employment can be, with many entering or leaving month to month.
Differing growth patterns by form of business
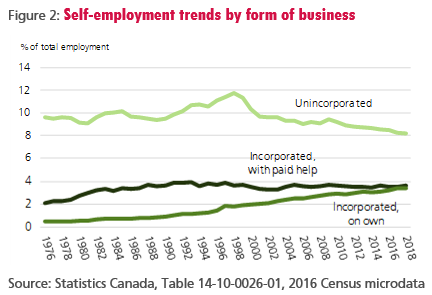
Self-employment grew rapidly in past decades, but the pattern depends on the form of business. The share of incorporated self-employed with employees doubled through the 1970s and '80s, but has steadied since. Growth in the numbers of those incorporated but on their own expanded more rapidly after 1990. Although still a sizable group, after a spurt of growth in the '90s, the presence of unincorporated businesses has tapered off.
Micro enterprises make up a large share of most industry sectors
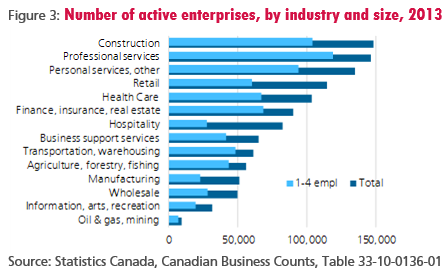
In most industry sectors, the business demographic is dominated by micro enterprises. Two-thirds of Canada's approximately 1.1 million private sector active enterprises employ fewer than 5 people. Construction and professional services--the sectors with the largest numbers of businesses also have the highest proportion of micro enterprises.
One-in-three people own or work in a small business
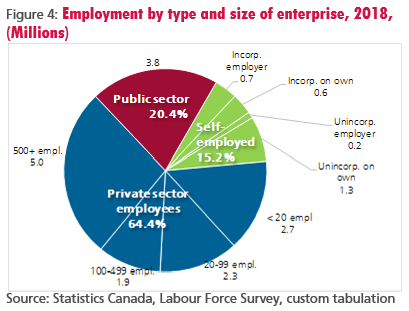
Looking at the size distribution of enterprises by the number of people they employ, small businesses account about one worker in three--split evenly between the self-employed and paid employees. Mid-size and large private enterprises account for almost half of total employment while about one person in five works for the public sector.
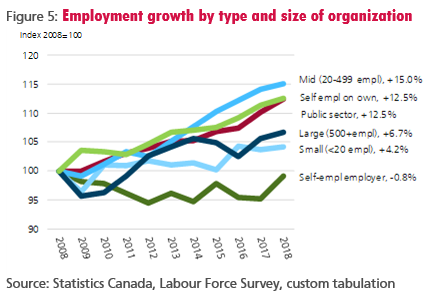
The business cycle affects growth trends by size of enterprise
Relative rates of employment growth by type and size of enterprise have varied widely in the past decade. Growth in mid-sized firms has been strongest and steadiest at 15.0 per cent. Growth in the public sector and among self-employed people on their own has been almost as strong at 12.5 per cent. Job growth among the largest and smallest businesses has been somewhat less (6.7 and 4.2 per cent respectively), while the number of self-employed employers has seen no change.
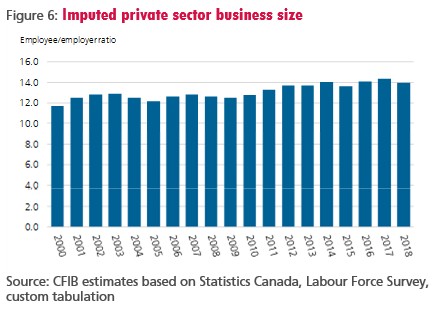
Average business size is increasing
Overall, these trends suggest that private sector employment is becoming more concentrated. A measure derived by dividing the number of private sector employees by the number of self-employed employers (both incorporated and unincorporated) show the average size rising from about 11.7 employees per business in 2000 to 13.9 by 2018--a size gain of about 19 per cent.
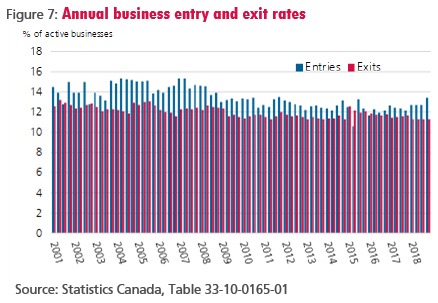
Business churn is slowing
Business entries and exits also play a big part in shifting employment patterns. Churn rates can rapidly transform the business environment. In any given year, between 11 and 15 per cent of businesses either come into existence or leave the marketplace. Entry rates have been gradually declining after the recession, but they remain just above the exit rates. Entries also tend to be more volatile than exits, suggesting the former are more sensitive to business cycles or policy environments.
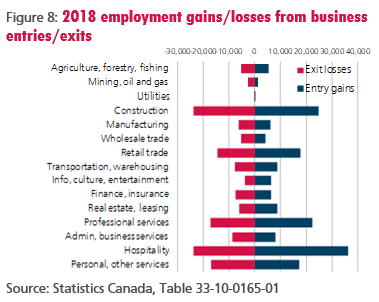
Employment gains are where the losses are
Churn still shows up by sector quite clearly. Relative differences in barriers to business entry mean that sectors with the highest employment creation numbers also have the highest losses. Hospitality, construction, professional services and retail all have high levels of employment creation and destruction from business start-ups and exits.
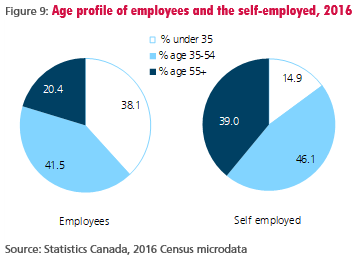
Business ownership is a maturing process
Self-employment is generally something started in midlife--after one acquires work experience, capital and contacts. Among the self-employed, only 14.9 per cent are under the age of 35, compared to 38.1 per cent of employees. At the other end of the scale, 39.0 per cent of self-employed are age 55 or over, compared to just 20.4 per cent of employees.
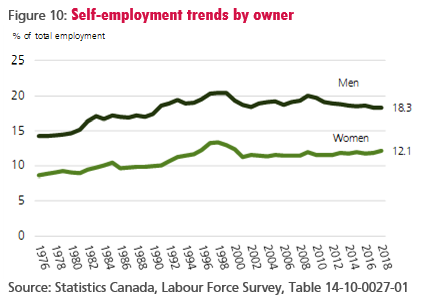
Trends in men- and women-owned businesses: different and equal
Men are more likely to own businesses than women, but the trends over time have followed similar paths. After significant gains through to the late '90s, the proportions of both men and women who are self-employed have leveled off.
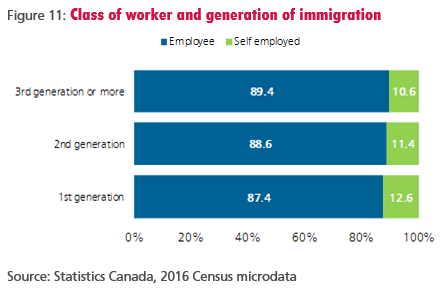
The positive influence of immigration
To a small but meaningful extent, first-generation Canadians are more likely to be self-employed than the native born. 12.6 per cent of first-generation immigrant workers operate the own businesses. Some of this entrepreneurial influence is preserved through to the second generation, where 11.4 per cent are self employed. For third-generation or longer settled Canadians, the proportion is lowest at 10.4 per cent.
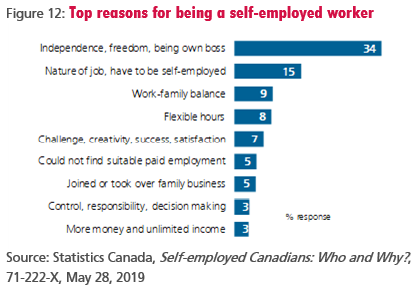
Owning a business is mainly a result of positive motivations
Most enter self employment with positive motivations around a desire for independence, balance, flexibility and a desire to be creative. Very few become business owners as a last resort or cite money as their chief motivation.
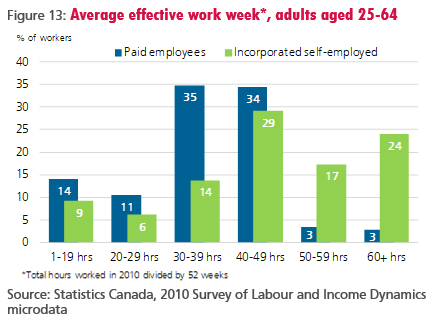
Typical work weeks are long
The work week is typically far more intense for business owners. Among those between the ages of 25 and 64, more than 40 per cent of owners work 50 or more hours per week--compared to only 6 per cent of employees. Business owners are about half as likely as employees to be working part time.
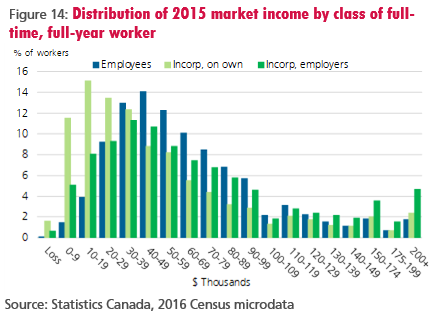
Incomes: small business owners are firmly in the middle class...
Owning a business is not synonymous with high earnings. In fact, most full-time, full-year employees earn more than owners of incorporated businesses. Employers are about five-times more likely to be earning under $30,000 than over $200,000. For business owners with no other employees, earnings are clustered mostly in the low-income range.
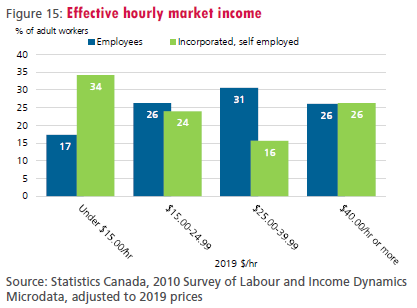
...more so when one includes work effort
Adding hours worked into the earnings equation tilts self-employment further into modest earnings categories. Among adult workers, almost one-in-three business owners are earning effectively $15/hr or less, compared to one-in-five paid employees. Note that this market income definition also includes dividends and investment earnings. Correspondingly, the proportion of business owners earning effectively more than $40/hr (26 per cent) is not far from that of paid employees (22 per cent).
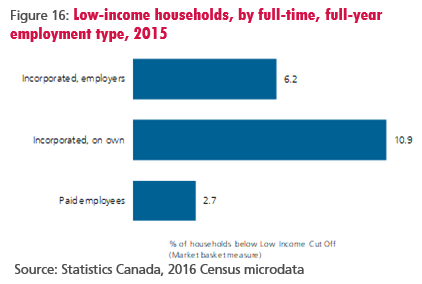
Self-employment is a more common definition of 'working poor'
The large numbers of low-income self-employed workers translates to a higher proportion of them being in low-income households compared to full-time paid employees. Uncertain and highly variable earnings may be part of it, but many business owners also choose to pay themselves less in order to re-invest in their business and their employees.
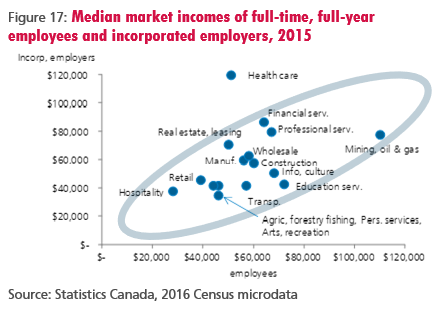
Low-wage sectors are also low-profit sectors for owners
Industries with low (high) employee wages also generate low (high) incomes for employers. Generally, median earnings of employers are proportionally in line with employees in the same industries. It suggests that the competitive profile and profit capacity of the industry sector determines the market wage/earnings levels for all participants.
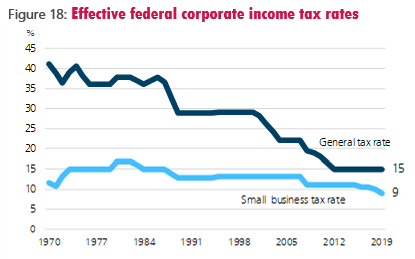
Fewer advantages to small business corporate taxation
Because of the Small Business Deduction (SBD), effective corporate income tax rates on small businesses are lower than the general corporate rate. The lower rate is meant to assist small firms to retain more earnings for growth capital. Reductions in the general rates in past decades, however, have narrowed the gap substantially. Currently, corporations pay 9 per cent federal tax on the first $500,000 of net earnings compared to 15 per cent on higher amounts.
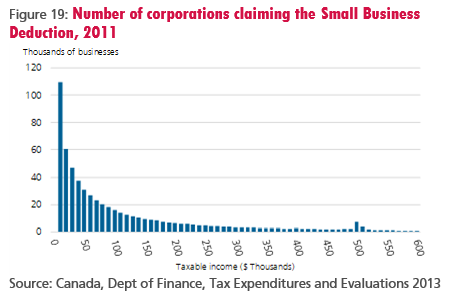
Barriers to small business growth not due to tax structure
Some have said the 500,000 net income limit for the Small Business Deduction (SBD) creates a disincentive to grow. The reality is very few small firms get even remotely close to that limit. In fact, 85 per cent of businesses could double their net earnings and still not be exposed to the higher general tax rate. The cluster of 8,000 or so businesses near the $500,000 mark represent only a small fraction of the 390,000 businesses netting less than $100,000 per year.
 Share Article
 Print Article
