Executive Summary
In this report, the Canadian Federation of Independent Business (CFIB), with sponsorship from Intuit Canada, partnered with the Small Business Roundtable to survey businesses in the United States (U.S.) to consider the impact of regulation on businesses in both Canada and the U.S. This is the second time that CFIB has conducted a comparison between the cost of red tape in Canada and the U.S. Though the first analysis of this kind was done in 2013,1 our report remains one of the only studies2 that compares both the cost of necessary regulation and excessive regulation (red tape) between the two countries.
While regulation is a key component of a well-functioning market economy, unnecessary regulation undermines productivity, lowers wages, and attacks the entrepreneurial spirit for no discernable benefit. In a reversal of previous results, current data shows that U.S. businesses dedicate more time spent to regulatory compliance than Canadian businesses. As can be seen in Figure 1, the smallest U.S. businesses spent an average of 263 hours per employee, including 88 hours on rules deemed unnecessary, complying with government regulation, while those with 100 or more employees spent only 19 hours. Canadian businesses fared better in comparison, though there is still significant room to reduce red tape. The time required for compliance, including on red tape, in both countries is still higher for businesses with fewer than five employees than any other business size.
Figure 1: Average annual time spent on regulation per employee, by size of business - hours
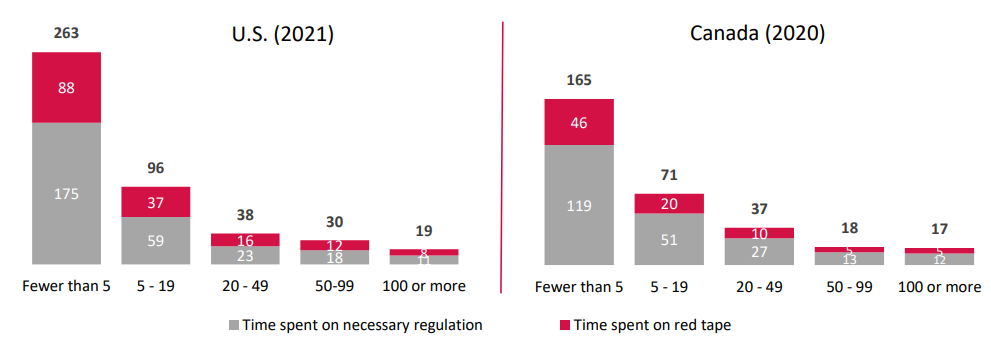
In the United States in 2021:
- Businesses with fewer than 5 employees spent 263 hours per employee on regulation (175 hours on necessary regulation and 88 hours on red tape)
- Businesses with 5 to 19 employees spent 96 hours per employee on regulation (59 hours on necessary regulation and 37 hours on red tape)
- Businesses with 24 to 49 employees spent 38 hours per employee on regulation (23 hours on necessary regulation and 16 hours on red tape)
- Businesses with 50 to 99 employees spent 30 hours per employee on regulation (18 hours on necessary regulation and 12 hours on red tape)
- Businesses with 100 or more employees spent 19 hours per employee on regulation (11 hours on necessary regulation and 8 hours on red tape)
In Canada in 2020:
- Businesses with fewer than 5 employees spent 165 hours per employee on regulation (119 hours on necessary regulation and 46 hours on red tape)
- Businesses with 5 to 19 employees spent 71 hours per employee on regulation (51 hours on necessary regulation and 20 hours on red tape)
- Businesses with 24 tp 49 employees spent 37 hours per employee on regulation (27 hours on necessary regulation and 10 hours on red tape)
- Businesses with 50 to 99 employees spent 18 hours per employee on regulation (13 hours on necessary regulation and 5 hours on red tape)
- Businesses with 100 or more employees spent 17 hours per employee on regulation (12 hours on necessary regulation and 5 hours on red tape)
Sources:
- Calculations based on CFIB’s Survey with the Small Business Roundtable on Regulation and Paperburden (conducted in 2021 in the United States, n = 1,765) and data from the United States Bureau of Labor Statistics.
- Calculations based on CFIB’s Survey on Regulation and Paperburden (conducted in 2020 in Canada, n = 4,603) and data from Statistics Canada.
Notes:
- The number of employees includes the business owner.
- The cost of red tape for each U.S. business size is determined according to the average per cent that businesses indicated the regulatory burden could be reduced by without sacrificing the public interest. The average percentage for each business size is as follows: fewer than 5 employees = 33%; 5-19 employees = 39%; 20-49 employees = 41%; 50-99 employees = 41%, and; 100 or more employees = 42%.
- The cost of red tape for each Canadian business size is determined according to the average per cent that businesses indicated the regulatory burden could be reduced by without sacrificing the public interest. The average percentage for each business size is as follows: fewer than 5 employees = 28%; 5-19 employees = 28%; 20-49 employees = 28%; 50-99 employees = 29%, and; 100 or more employees = 32%.
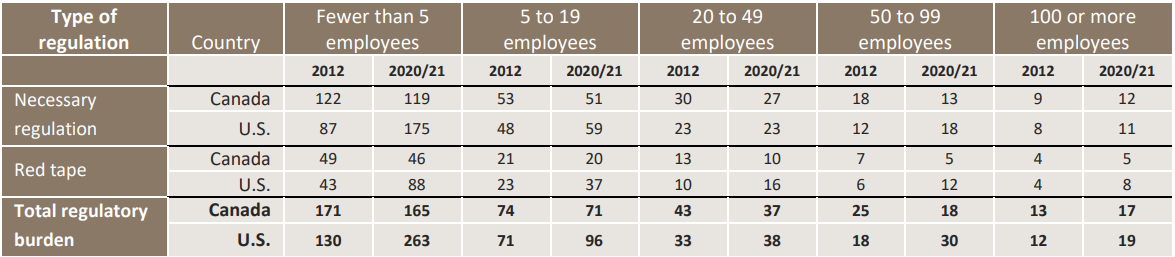
Looking back to our 2013 analysis, the average time spent on regulation per employee in Canada has stayed relatively stable. For example, in 2013 the smallest Canadian businesses reported spending a total of 171 hours each year on regulatory compliance (see Table 1), whereas they report spending 165 hours as of 2020. Conversely, the time spent by the smallest U.S. businesses on compliance has grown significantly over the same period, from 130 to 263 hours.
Table 1: Average annual time spent on regulation per employee, by size of business ‑ hours
Sources:
- Calculations based on CFIB’s Survey on Regulation and Paper Burden in the United States (conducted by Ipsos Reid in 2012, n = 1,535); and CFIB’s Survey with the Small Business Roundtable on Regulation and Paperburden (conducted in 2021 in the United States, n = 1,765) and data from the United States Bureau of Labor Statistics.
- Calculations based on CFIB’s Survey on Regulation and Paper Burden (conducted in Canada in 2012, n = 8,562 and 2020, n = 4,603) and data from Statistics Canada.
Note:
- Canada 2020, U.S. 2021.
U.S. businesses attribute a higher share of their regulatory burden to being red tape (36%) in comparison with Canadian businesses (28%).3 The share attributed to red tape has remained relatively stable in Canada (29% in 2013), while there has been a notable uptick in the U.S. since 2013 when it stood at 32 per cent.
As of 2021, the total cost of regulation to U.S. businesses is estimated to be $364.3 billion USD, and $31.9 billion USD for Canadian businesses. This is largely explained due to major differences in the size of the two economies. It is more telling to examine the per-employee costs of regulation. As with hours spent on regulation, the smallest businesses pay significantly more per-employee. In Canada, the smallest businesses spend more than nine times as much per employee on regulatory compliance compared to the biggest firms, while the gap in the U.S. is even larger, with small firms paying nearly fourteen times as much. Although these numbers exclude the costs of complying with COVID-19 related regulations, it should be noted that such costs are not trivial for businesses in either country.
With these results in mind, it is unsurprising that over 80 per cent of businesses in both countries say it is important that their local/municipal, state/provincial, and federal governments be committed to reducing red tape. When asked if those same governments were committed to doing this, however, a strong majority of businesses expressed a lack of confidence in their respective governments. This signals that red tape reduction and regulatory modernization should continue to be a key area of focus for governments in both countries when it comes to addressing the priorities of their small business communities.
Related Documents
| Release Date | Report | Download |
|---|---|---|
| February 2022 | Regulatory Costs in Canada and the Unites States: A Small Business Perspective | PDF (859 KB) |
| February 2013 | Canada’s Red Tape Report with U.S. Comparisons, Third Edition | PDF (859 KB) |
Notes:
- Jones et.al, Canada’s Red Tape Report with U.S. Comparisons. CFIB, 2013.
- Mercatus Center at George Mason University produces datasets for the U.S. and Canada that analyze the of volume of regulatory restrictions.
- Red tape includes excessive government regulation (i.e., unfair, overly costly, poorly designed, or contradictory rules and regulations), unnecessary delays and poor government customer service. Excessively long government forms, unnecessary permits, or long wait times to speak to a government representative are all considered red tape.
CFIB would like to thank Intuit Canada for sponsoring this year’s report and the Small Business Roundtable for partnering with us on the U.S. survey and report. This edition compares regulatory costs in the United States with those in Canada, as were last determined in Canada’s Red Tape Report for 2021.
 Share Article
 Print Article
