
Business and entrepreneurship are at the heart of economic activity. Some firms and entrepreneurs become enduring economic success stories that may even span multiple generations, yet many others animate the continuous cycle of entries, growth and exits. Tracking business and entrepreneurial activity allows us to get a good assessment of Canada’s overall economic health.
CFIB’s Enterprise Pulse presents an overview of the continuum of economic activity, from the one-person businesses (self-employed with no employees) to active businesses with employees and the churn within this category (business entries and exits), to the insolvency numbers. This page offers a brief quarterly report covering the latest publicly available data, and an interactive dashboard allowing readers to drill down using tailored visualizations. Scroll down to discover these tools.
Q3 2025
Canadian Entrepreneurship Finding Firmer Footing
|
Highlights
|
Self-employment in Canada (Q4 2025): Nearing pre-pandemic levels, but growth has been stagnant
Over the past four quarters, Canada has averaged approximately 1.98 million self-employed. The most recent reading (Q4 2025) is close to the peak reached in Q4 2019, but despite its zig-zagging movement in 2025, it has remained flat over the entire 2025 period.
Self-employed, quarterly data, Canada, Q4 2025
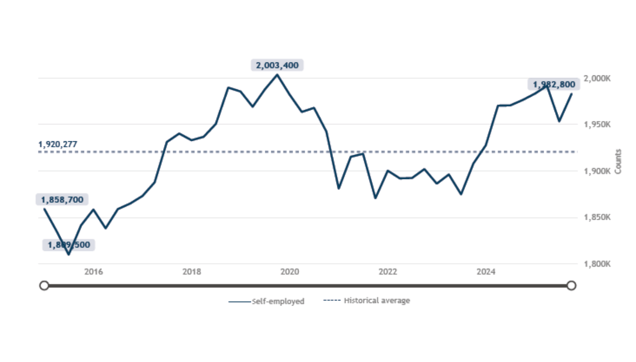
Note: Self-employed data presented quarterly from Q1 2015 to Q4 2025. It includes both incorporated and unincorporated self-employed without employees.
Source: Statistics Canada. Custom tabulation for CFIB.
In per capita terms, self-employment has also remained virtually flat, with about 480 self-employed individuals per 10,000 people since Q2 2024. By comparison, pre-pandemic levels averaged closer to 530 per 10,000 in the four quarters leading up to early 2020.
Self-employed per 10,000 people, quarterly data, Canada, Q4 2025
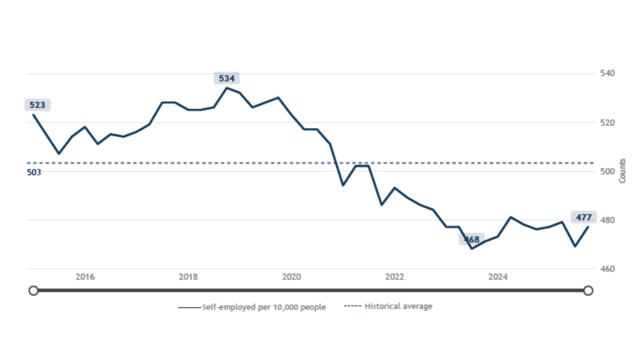
Note: Self-employed data presented quarterly from Q1 2015 to Q4 2025. It includes both incorporated and unincorporated self-employed without employees.
Sources: Statistics Canada. Custom tabulation for CFIB.
Table 17-10-0009-01, population estimates.
Businesses with employees (Q3 2025): Growth is concentrated in a few sectors only
The number of active businesses with employees has remained almost flat during 2024 and 2025. The current number represents a bare 4% increase compared to Q4 2019.
On a year-over-year basis, the number of businesses with employees increased by 1,568. The lion's share of the net business creation was registered in the health and education sector (+1,494 firms). Hospitality and construction saw some gains in the number of businesses, while arts and recreation remained almost unchanged (+57 firms increase). All other sectors saw declines, the most notable drops being in transportation (-1,412), retail (-1,111), and wholesale (-863).
Net change during the past 12 months in the number of businesses with employees, quarterly data
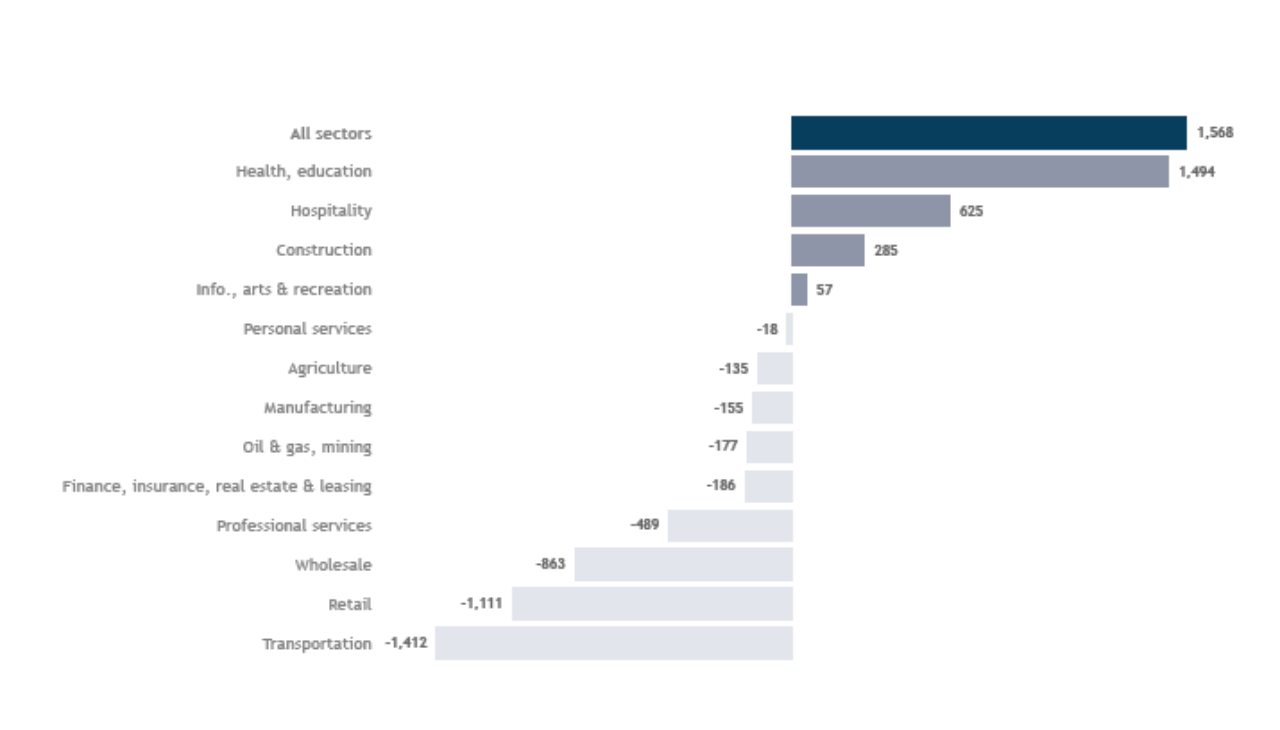
Note: Business with employees data presented as a change between Q3 2024 and Q3 2025.
Source: Statistics Canada.
The Q3 2025 number of 225 businesses with employees per 10,000 of population is below the level registered before the pandemic of 240. The number of businesses with employees per 10,000 of population has been on a downwards trend for the past 10 years. After the abysmal level of 211 reached in 2020, the number has increased until Q2 2022 when it was back up to the pre-pandemic level of 240. However, since then, it has been following a steeper-than-before-2019 downwards trend. This may be due, in part, to the rapid population growth since 2022 and in part to the tough economic climate which has seen less business creation.
Businesses with employees per 10,000 people, quarterly data, Canada, Q3 2025
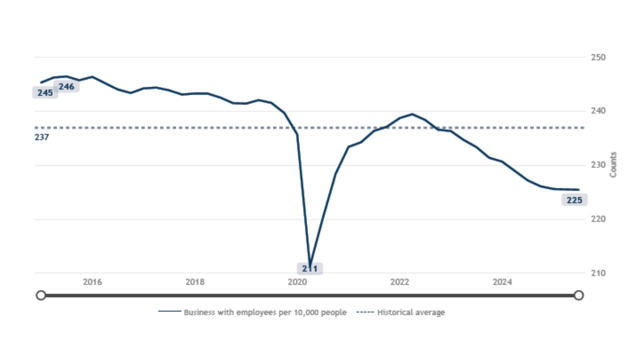
Note: Business with employees data presented quarterly from Q1 2015 to Q3 2025.
Sources: Statistics Canada.
Table 17-10-0009-01, population estimates.
Business entries and exits (Q1 2025): Net negative for a fifth consecutive quarter
For five consecutive quarters, the business landscape has been marked by exits surpassing entries. A similar trend has been previously observed from Q3 2019 to Q2 2020. Since Q3 2020, Canada experienced healthy net business creation until Q1 2022. However, since then, business creation started dropping until finally it dipped into negative territory in Q1 2024 and it has intensified ever since.
Net change, quarterly data, Canada, Q1 2025
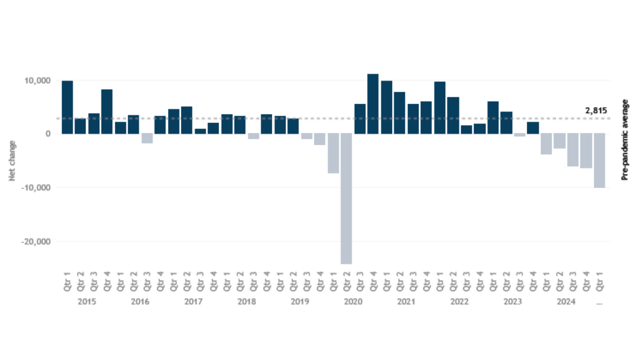
Note: Net change = [Business entries] - [Business exits]. Pre-pandemic average = Q1 2025 to Q4 2019.
Net change data presented quarterly from Q1 2015 to Q1 2025.
Source: Statistics Canada.
Businesses insolvencies (Q4 2025): Bankruptcies and proposals have dropped significantly but are still above historical average
The number of insolvencies dropped to 1,110 in Q4 2025 for all sectors from the peak of just over 2,000 bankruptcies seen in Q1 2024. Business insolvencies surged to alarming levels in Q1 2024, but they have been dropping ever since to the current level.
Business insolvencies, quarterly data, Canada, Q4 2025
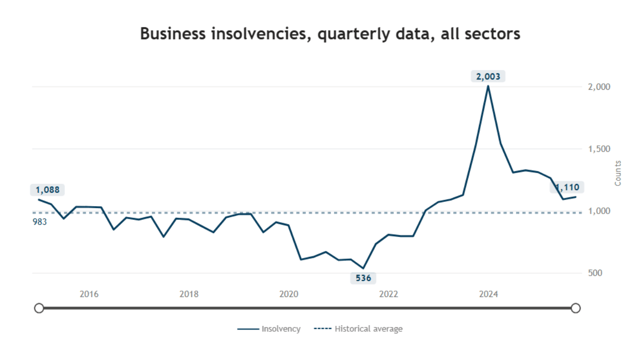
Note: Business insolvencies data presented quarterly from Q1 2015 to Q4 2025. Chart is based on sectoral numbers.
Source: ISED Canada.
 Share Article
 Print Article
