
The 2026 edition of the report card assesses how federal, provincial, and territorial governments are advancing interjurisdictional cooperation and reducing barriers to internal trade. It provides a snapshot of the progress made over the past year and highlights the work still needed to build a more integrated Canadian economy.
This year’s report card continues to grade three major areas of interprovincial/territorial cooperation:
- Canadian Free Trade Agreement (CFTA) exceptions;
- The existence of inter-jurisdictional barriers to internal trade; and,
- The implementation status of items from reconciliation agreements.
In addition, a mutual recognition multiplier further rewards jurisdictions that have implemented mutual recognition for goods, services, and labour.
Within this framework, top-performing governments are those with the fewest exceptions and have made the most progress towards reducing specific barriers, or have fully legislated and implemented mutual recognition legislation and/or policies.
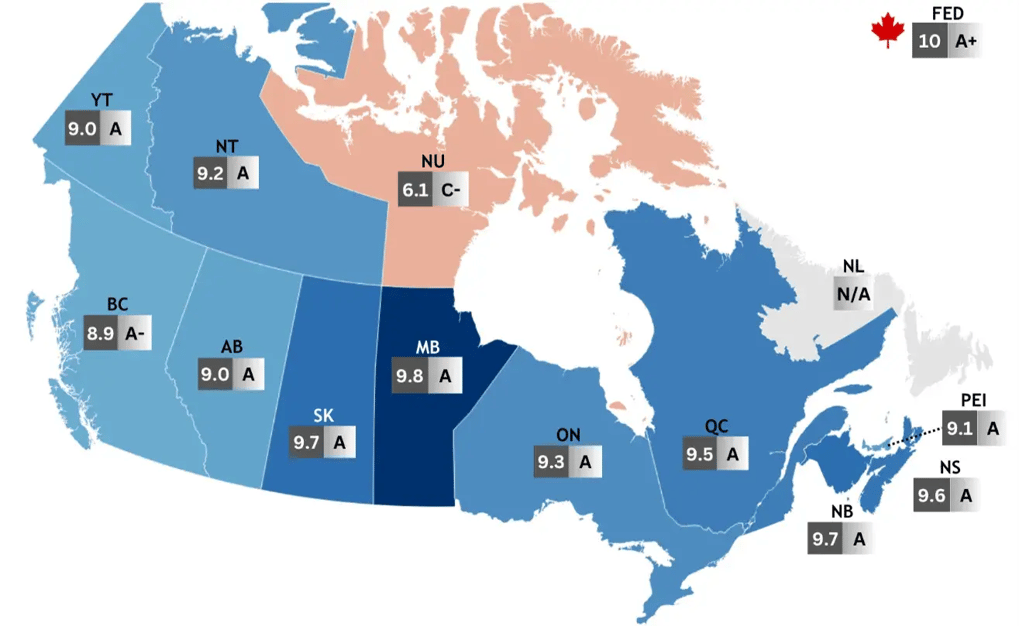
This year’s results show clear improvement, with the federal government earning an A+ and ten provinces achieving A’s, driven largely by mutual recognition legislation and agreements.
Interprovincial/Territorial Cooperation Report Card, Overall Score and Grade1
Areas of Interprovincial/Territorial Cooperation, Score and Grade1, 2
| Jurisdiction | I. Canadian Free Trade Agreement Exceptions (40%) |
II. Select Barriers to Internal Trade (20%) |
III. Status of Items from Reconciliation Agreements (40%) |
Mutual Recognition (Multiplier) | Overall Score and Grade | ||||
|---|---|---|---|---|---|---|---|---|---|
| FED3 | 10 | A+ | NA | NA | 9.7 | A | 10 | 10.0 | A+ |
| MB | 7.3 | C+ | 5.4 | D | 9.6 | A | 9 | 9.8 | A |
| SK | 6.9 | C | 5.3 | D | 9.2 | A | 9 | 9.7 | A |
| NB | 5.9 | D | 6.4 | C- | 8.8 | A- | 9 | 9.7 | A |
| NS | 2.5 | F | 6.9 | C | 9.1 | A | 9 | 9.6 | A |
| QC | 0.0 | F | 5.0 | D | 9.6 | A | 9 | 9.5 | A |
| ON4 | 10.0 | A+ | 6.1 | C- | 8.4 | B+ | 5 | 9.3 | A |
| NT | 4.9 | D | 2.0 | F | 8.8 | A- | 8 | 9.2 | A |
| PEI | 3.3 | F | 4.3 | D | 8.8 | A- | 8 | 9.1 | A |
| AB | 8.0 | B | 4.9 | D | 9.5 | A | 5 | 9.0 | A |
| YT | 2.7 | F | 3.0 | F | 8.8 | A- | 8 | 9.0 | A |
| BC | 7.6 | B- | 4.1 | D | 9.6 | A | 5 | 8.9 | A- |
| NU | 4.6 | D | 2.0 | F | 8.6 | B+ | 1 | 6.1 | C- |
| NL* | 4.3 | D | 2.7 | F | 8.5 | B+ | 1 | NA | NA |
Notes:
- Score: 10 is best, 0 is worst. The scores of the three areas of interprovincial/territorial cooperation are combined into a single score that allows for a ranking of governments from best (highest score) to worst (lowest score).
- Grade: A+, A, A-: 8.7-10 (Excellent performance); B+, B, B-: 7.5-8.6 (Good performance); C+, C, C-: 6.0-7.4 (Satisfactory performance); D: 4-5.9 (Less than satisfactory performance); F: 0-3.9 (Unsatisfactory performance).
- The federal government is scored on two areas: an economic impact score based on the procurement exceptions it maintains from the CFTA in 2025, and the implementation status of reconciliation agreements. Both areas are weighted equally (50% each), as the select barriers area was not available for this analysis.
- While “A+” is not currently included in the grading scale, Ontario and the federal government are awarded an A+ in the area of Canadian Free Trade Agreement Exceptions for having no exceptions.
*NL given an NA due to recent change in government.
CFIB applauds the significant progress made, but cautions that high grades largely reflect commitments and policy intentions more than progress felt on the ground.
After years of studies, commitments, and signings of MOUs, small business owners are still waiting for changes to improve their day-to-day operations: fewer barriers, streamlined approvals, and improvements to how they operate across Canada.
To better capture this reality, CFIB will update its report card methodology in 2027 to place greater weight on measurable outcomes and the lived experiences of small business owners navigating internal trade rules.
 Share Article
 Print Article
