



September 2026 Results
Key takeaways
-
Small business optimism dropped severely both over the long and short term.
-
Current business health also declined.
-
The price increase plans jumped to 3.3%.
-
Fuel costs are the top cost constraint on business growth
To listen to the highlights:
Small business optimism in Canada
CFIB’s Business Barometer® long-term index, which is based on 12-month forward expectations for business performance, dropped sharply by 10 points to 47.9. The short-term optimism index, based on a 3-month outlook, also dropped by 10 points to 43.3.
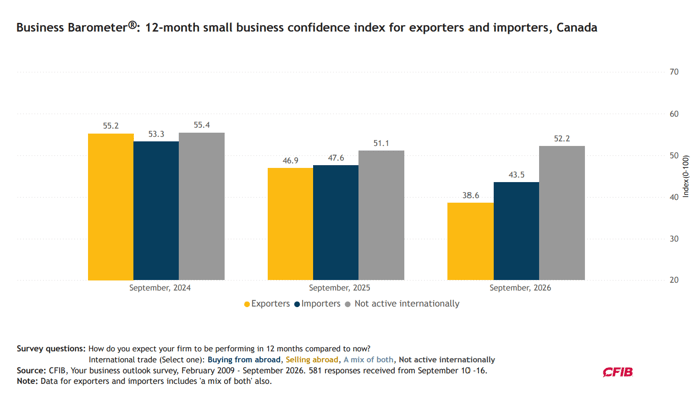
Optimism for firms trading internationally
Firms trading internationally show lower levels of optimism than businesses active only on the Canadian markets. Compared to September 2025, exporters dropped about eight points to 38.6, while importers hoover around the mid-40s (43.5 in September 2026).
Provincial picture
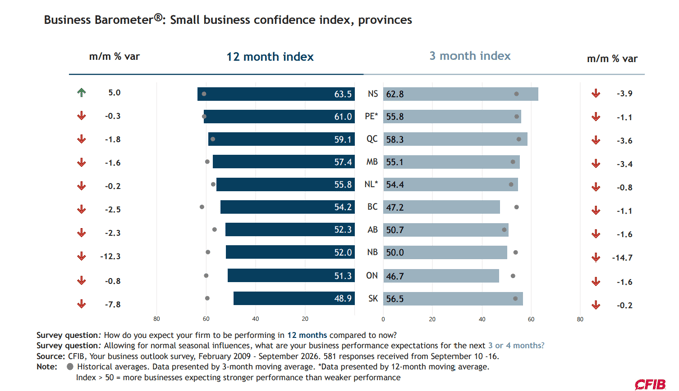
Provincial trends—calculated as three‑month moving averages—also fell but the indices are delayed in showing the major decline in business confidence. Confidence among the four largest provinces remains muted. Quebec (59.1), British Columbia (54.2), Alberta (52.3), and Ontario (51.3) all posted declines, highlighting growing caution among small businesses in Canada's largest provincial economies.
Sectoral overview
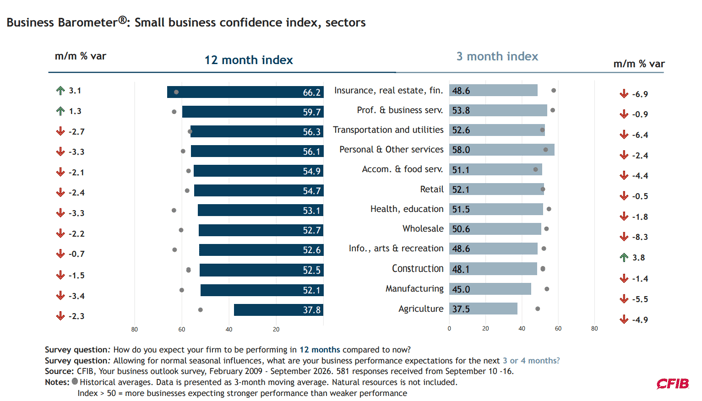
Sectoral confidence—also calculated as three‑month moving averages—remains weakest in agriculture, manufacturing and construction. Agriculture continues to lag well behind all other sectors (37.8), while manufacturing (52.1) and construction (52.5) also saw notable declines in confidence this month. In contrast, service-based industries are faring somewhat better, with insurance, real estate and finance (66.2), and professional services (59.7) posting the strongest confidence readings.
State of business health
The balance of opinion on the current state of business health declined to 15, after several months of trying to reach the historical average.
Inflation indicators
The average price increase plans jumped to 3.3% in September, a significant increase from earlier this year, while the average wage increase plans remained unchanged at 2.4%. For more details about price and wage plans, click here.
Other indicators
Full-time staffing plans remained weak, with a higher share of employers planning to lay off staff (16%) than to hire (13%).
Insufficient demand remains the top limitation on business and production growth, cited by 49% of SMEs. Distribution constraints and limited cash flow were also on the rise this month.
Fuel costs are the top cost constraint (62%). Product input and raw material costs also remained significant constraints, with 42% of SMEs reporting each as a major constraint. Shipping and receiving costs are a problem for about half of small firms.
Methodology
These results are based on 581 responses received from September 10 to 16 from a stratified random sample of CFIB members to a controlled-access web survey. Findings are statistically accurate to +/- 4.1 per cent 19 times in 20.
Every new month, the entire series of indicators is recalculated for the previous month to include all survey responses received in that previous month. Accordingly, August results were recalculated to include 18 additional responses beyond the 278 originally used.
Measured on a scale between 0 and 100, an index below 50 means owners expecting their business’s performance to be weaker over the next three or 12 months outnumber those expecting stronger performance.
Since February 2026, the survey includes two new data points on shipping and receiving costs; and on shortages of equipment and technology.
As of April 2026, our industry codes align fully with NAICS, resulting in slight composition changes in agriculture, natural resources, transportation, and health and education. Questions? Contact us directly.
More details
Regional data about business optimism, price plans, limitations and cost constraints:
The Business Barometer, 2025 Retrospective.